
Here is statistical evidence on the expected increase in proposal activity in April. OCI has been tracking monthly revenue for 18 years. The graph presents a picture of the increase in proposal activity seen in the month of April — in years following a presidential election.
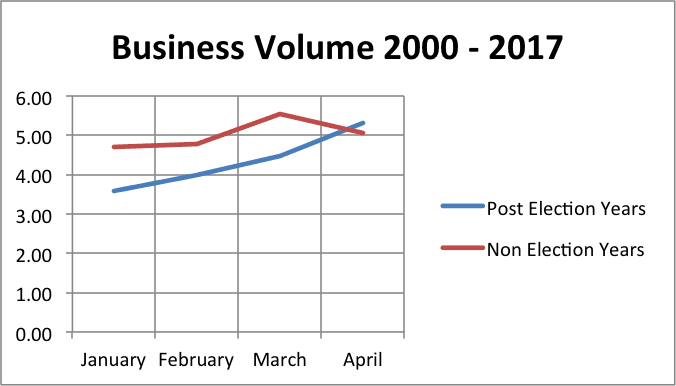
The graph above is based on averages of (1) the four post-election years – blue line — and (2) the other thirteen years in the 2000 – 2016 timeframe – red line.


Leave A Comment